Workshop
How exactly do you make an atlas? And how are the maps in the atlas made?
The steps needed to create maps incorporating countless ideas and compile an atlas are described below.
Planning and design
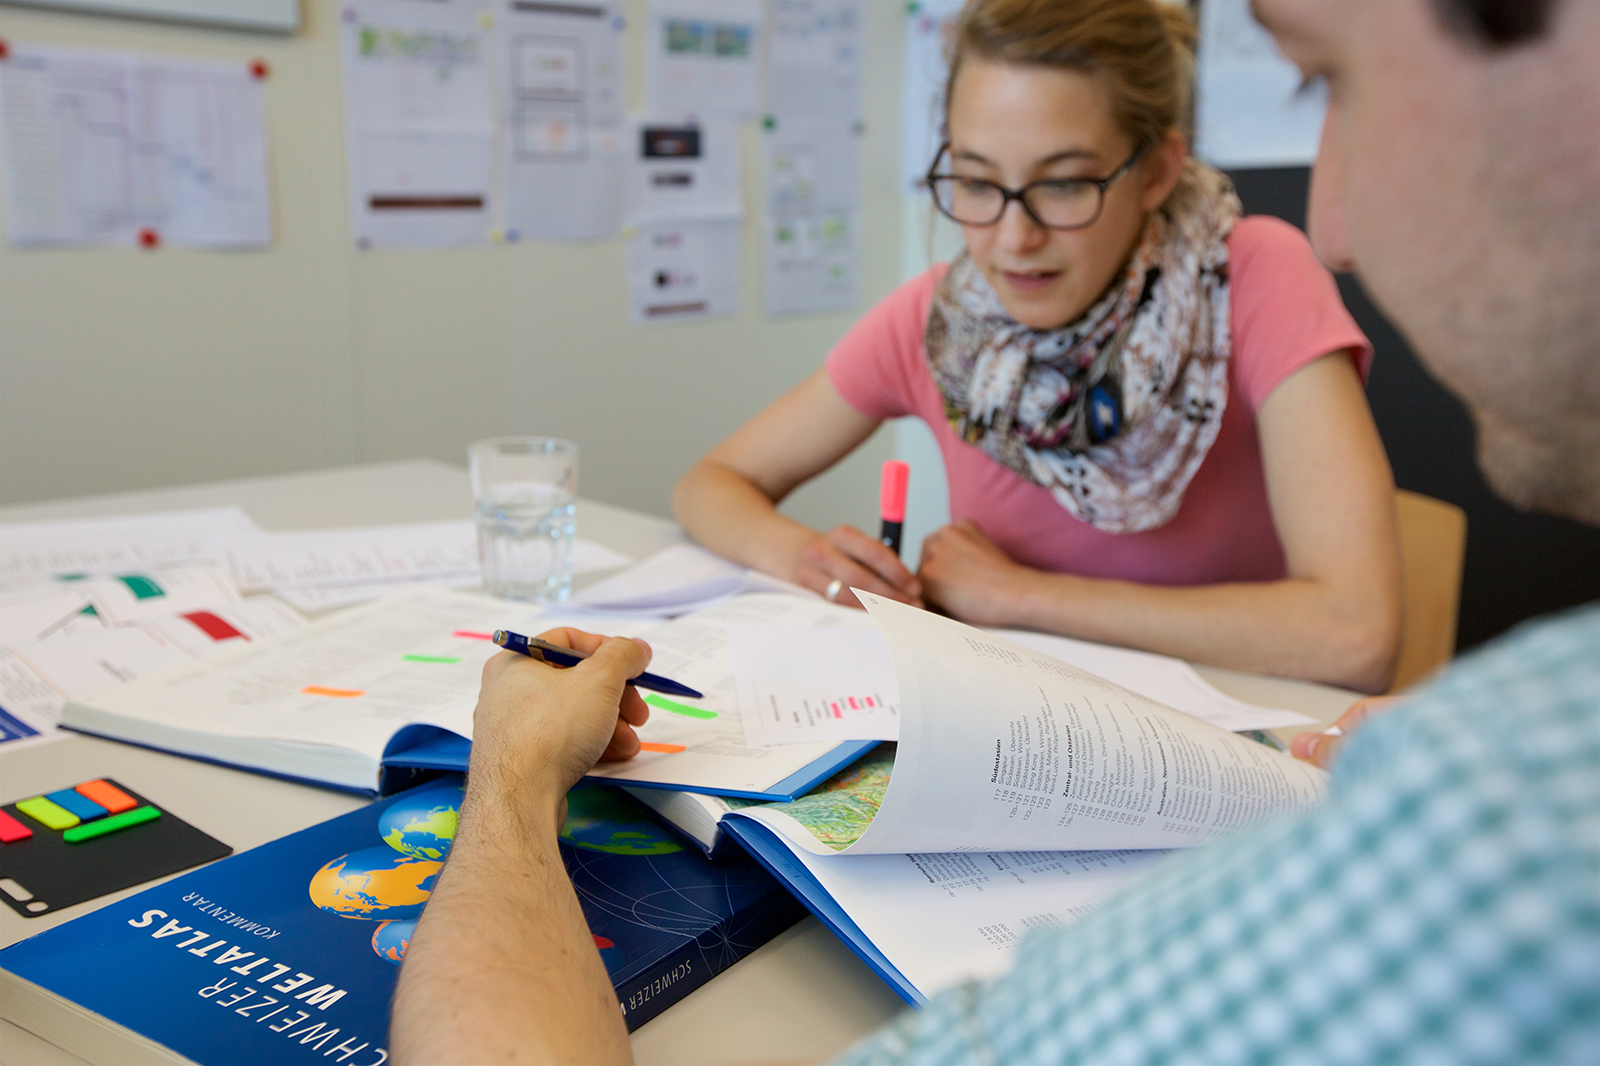
Before we start compiling the Swiss World Atlas, we must first plan the project from start to finish. The same applies to each individual map. The team therefore develops and discusses ideas and concepts, before fleshing them out with further detail and defining the fundamental content, aims, and features of the atlas and its maps.
First, planning begins for the new 2017 edition of the Swiss World Atlas. The aim of the publication is set out by our client, the Swiss Conference of Cantonal Ministers of Education (EDK):
the atlas must be suitable to use as a teaching and learning material for multilingual Switzerland and meet all the needs of its main target readership, namely staff and students at the secondary level. The atlas must also take into account the requirements of the different curricula for a skills-oriented approach to teaching based on defined learning objectives. The Swiss World Atlas must also be able to be used as a general reference work by people at home. The high quality of the maps in the atlas must also be maintained. A comprehensive concept is then devised on this basis, setting out the principal form, structure and content of the atlas. These criteria will inform the selection of geographical topics and areas, as well as the manner in which these are depicted in the maps.
Once the fundamental planning stage is complete, concrete, relevant and topical geography topics are chosen for inclusion in the atlas. When choosing topics, the editorial team refers to the mandatory content of the relevant curricula, and particularly to the topics ‘Space, time and societies’ and ‘Geography’.
The map themes should help students to develop skills like spatial orientation. Likewise, the map themes should reflect the core concept of ‘sustainable development’ and foster a problem-oriented approach. Other existing learning materials also help the editorial team to select suitable map topics for the classroom. Academic publications are referred to in order to guarantee factual accuracy and ensure that the atlas reflects modern scientific opinion.
One example of this process is the creation of a map based on the topic of water as a natural resource. The creation of this map is described below.
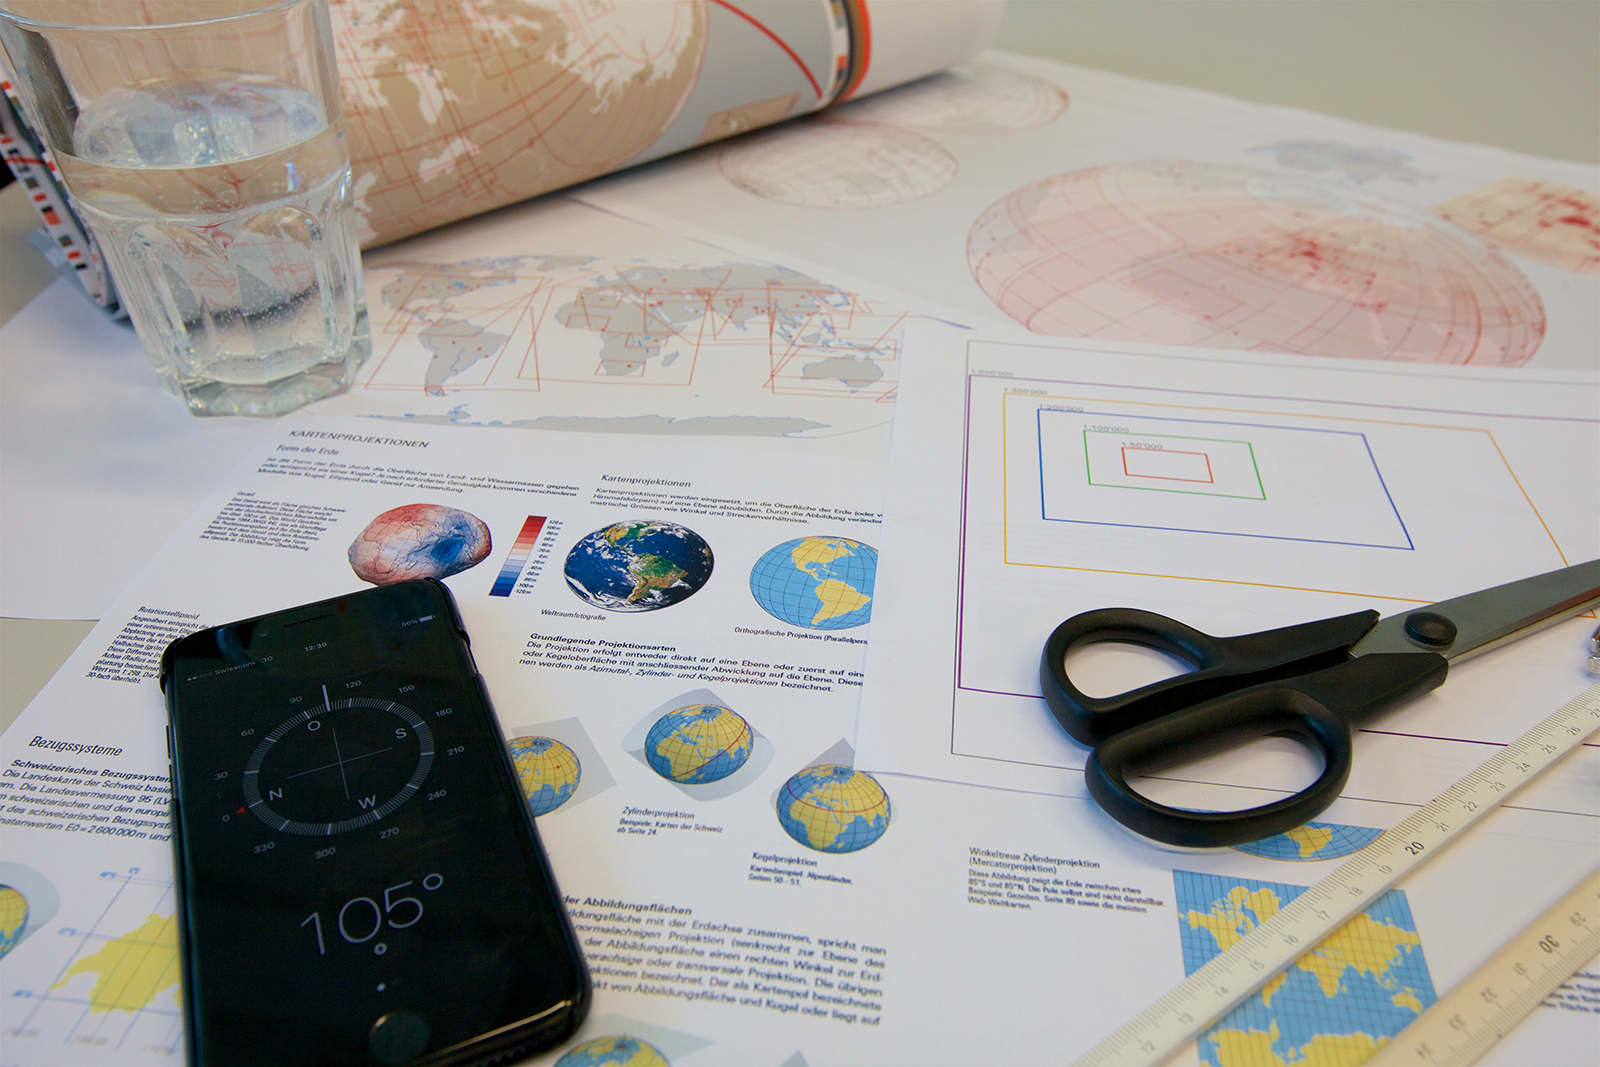
In order to illustrate the selected topic, the editorial team must first define the geographical area concerned, whether it be a city, a region, a continent or the entire planet. An appropriate map projection is chosen depending on the aim of the map and the geographical area concerned.
Next, the team selects an appropriate scale and format for the map. These depend on the desired level of detail on the topic and the space available in the atlas. In the Swiss World Atlas, the scale and format of the maps are standardised wherever possible. The empty map placeholder is thus defined accordingly.
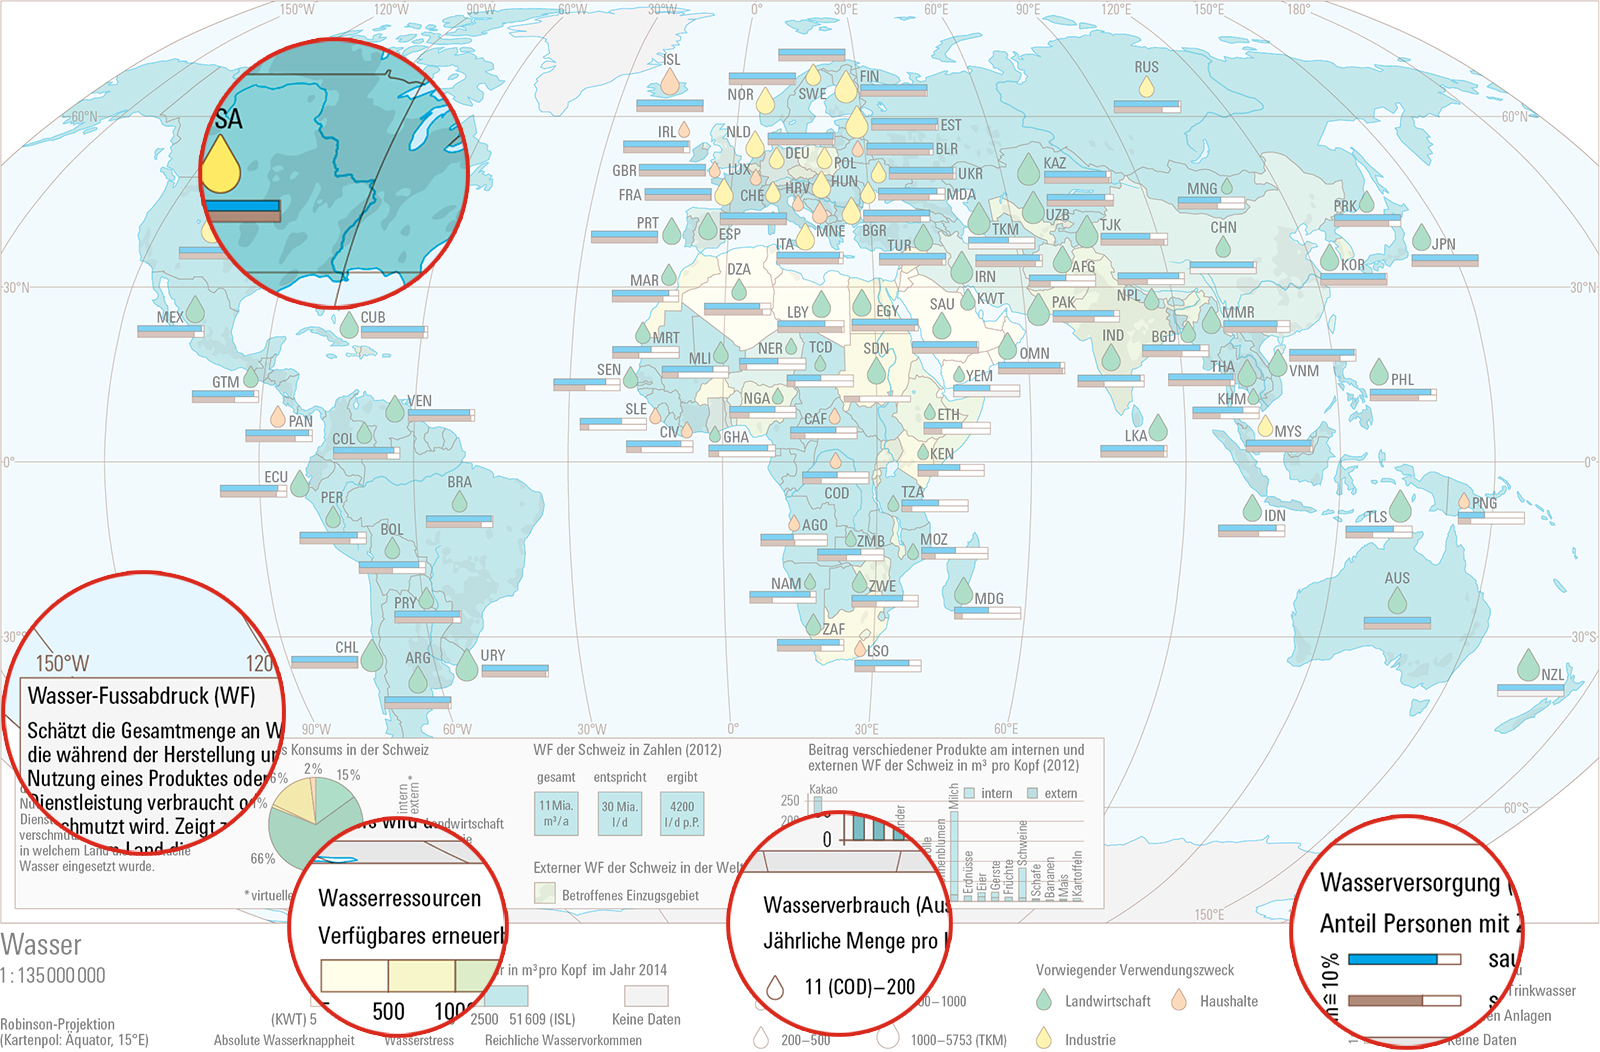
For the map topic ‘Water’, the editorial team decided to present information at a global level to illustrate worldwide interdependencies. As no specific projection is required to illustrate this topic, the team opted for a standardised, half-page map of the Earth in the Robinson projection.
As there is only limited space, complex, interrelated geographical topics must be condensed in order to avoid overcrowding the map. Some subtopics are either given a superficial treatment or are left out altogether. In contrast, important topics are deliberately emphasised.
The reduction of the material takes place for didactic reasons. What content is required to ensure understanding of the topic? And what content can be presented given the available space? Very often, an exemplary approach is taken based on selected examples and case studies. Furthermore, the maps must cater to various levels of map skills while illustrating both simple and complex topics. On occasion, detailed data is not available and a map must therefore be simplified.
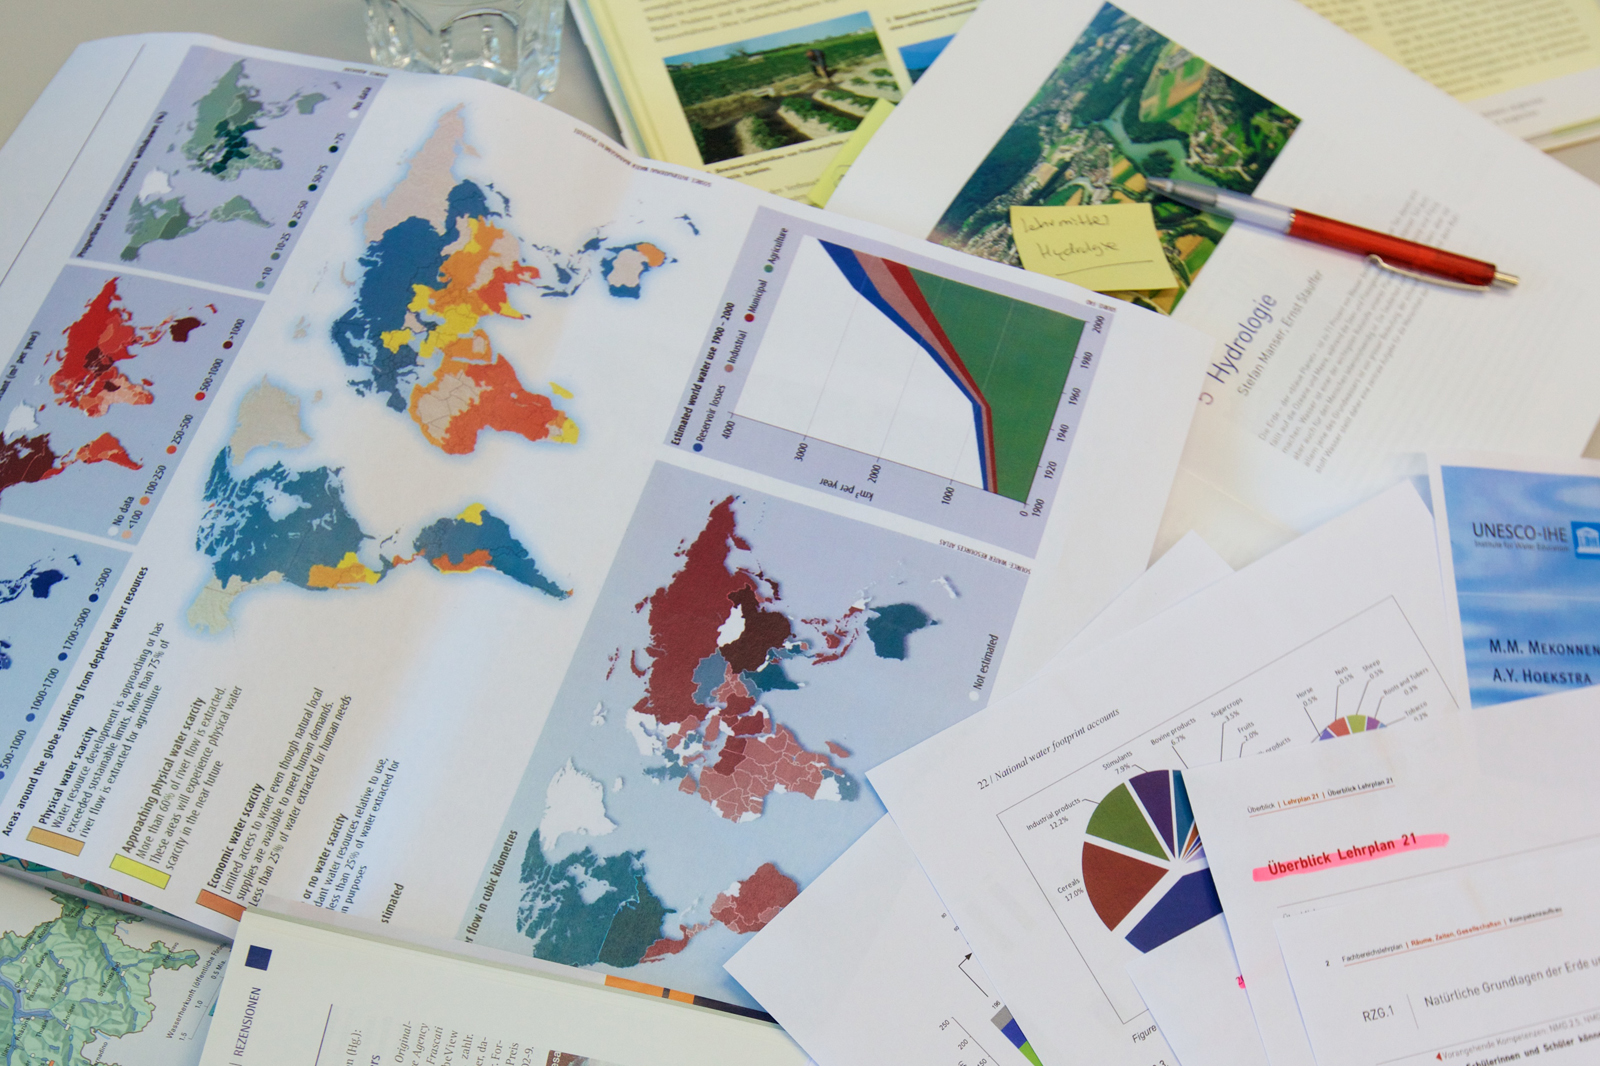
For the world water map, the editorial team chose to present water resources, the quantitative and qualitative use of these resources by people, and the water supply. Thanks to the subtopics virtual water and the water footprint, students are able to relate the information in this map to their own lives.
Creating the maps and atlas
For the maps, our second step is to collect, prepare and analyse data. This information will then be used to design a number of draft maps dealing with the same topic and geographical area in different ways. These maps are then checked and shown to experts and school students until either one of the drafts is chosen or the team opts for an entirely different approach. The finished maps are then integrated into the atlas.
This is the stage during which the data for each topic is provided. Usually, the data must be prepared and coordinated, or calculations and analyses must be conducted (e.g. to determine the virtual water basin).
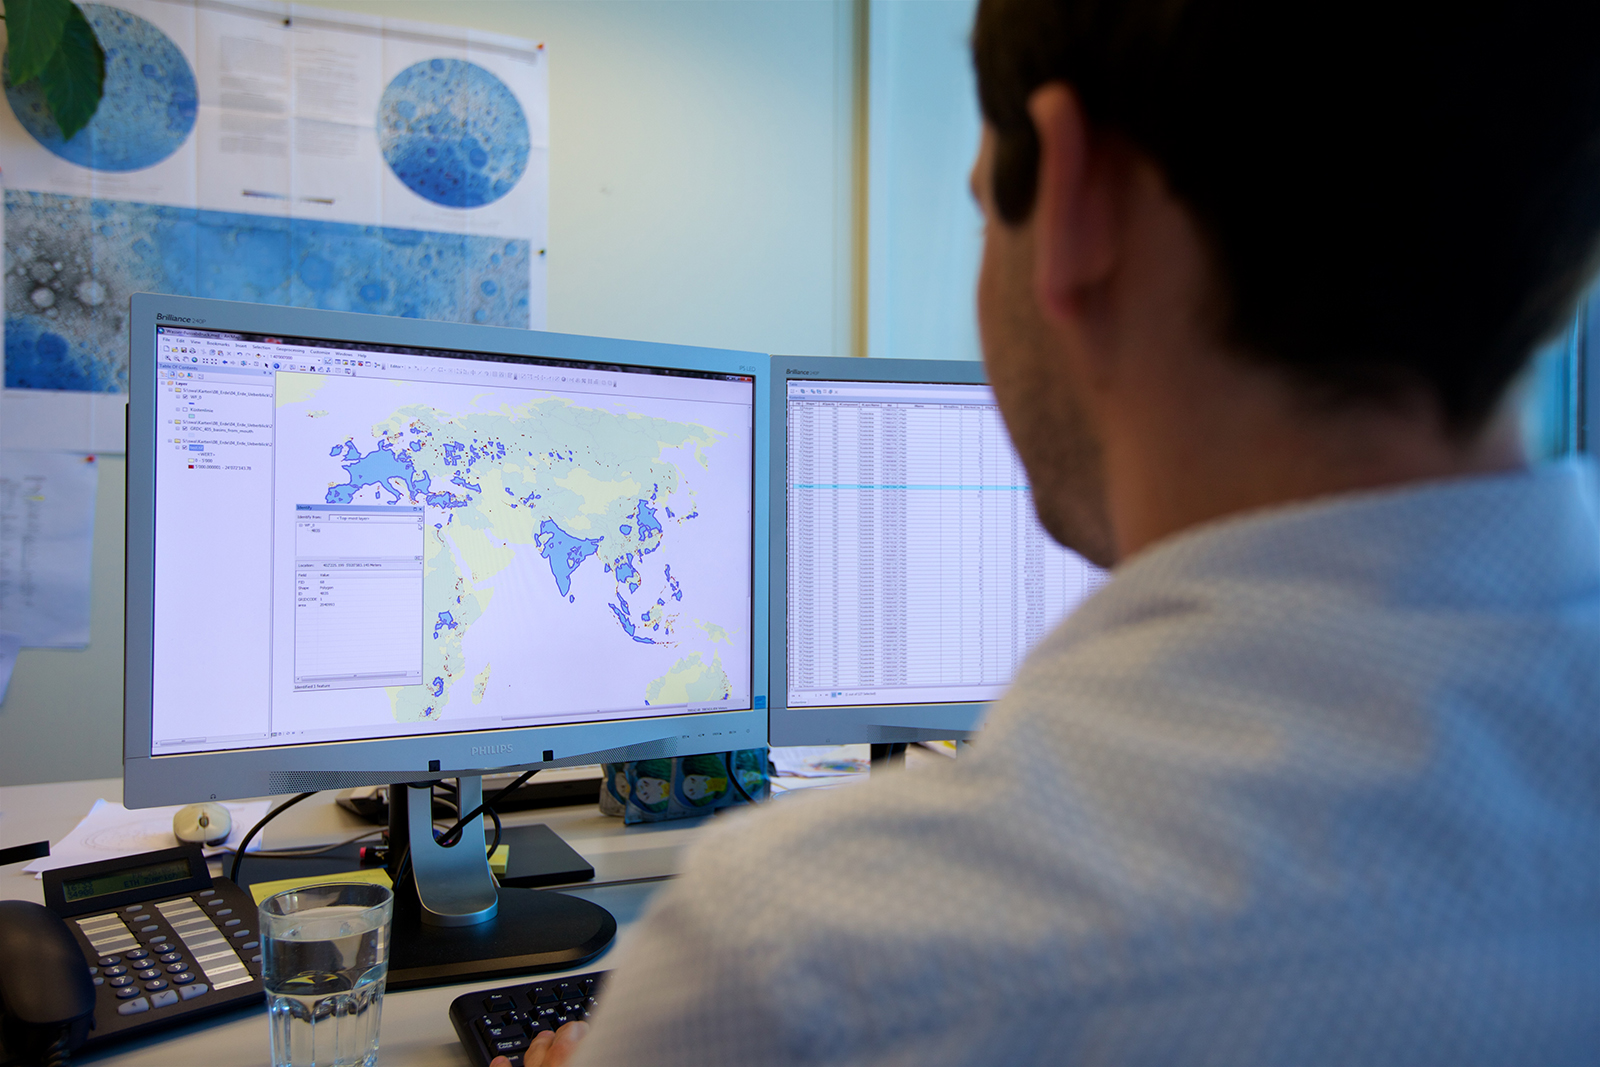
Very often, it is also necessary to generalise content (i.e. simplify the data, such as by categorising water resources per capita) or geometry (e.g. by simplifying geographical borders). The geometric and topical data is then loaded into graphics software and correlated further (e.g. by allocating countries’ available water resources per capita to the relevant areas on the map).
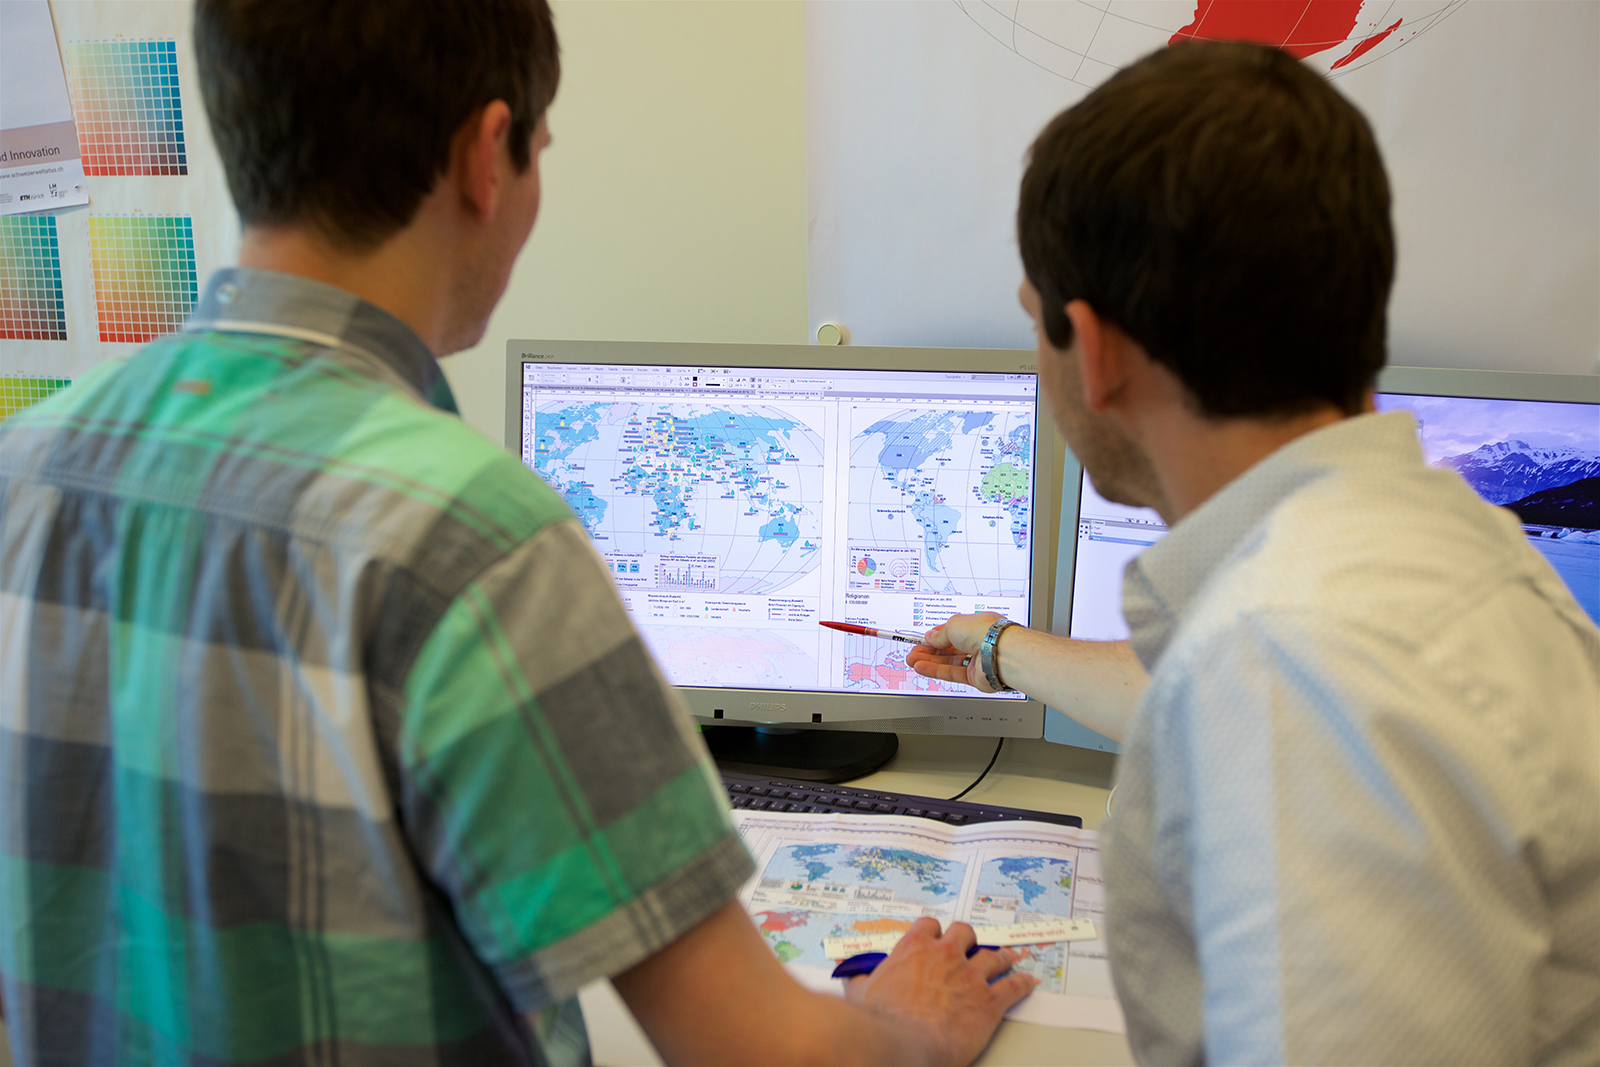
The graphic software allows the editorial team to design each map and determine the graphical representation of each element on the map.
For the maps in the Swiss World Atlas, a standardised legend of symbols is used wherever possible. This means that the same symbol always represents the same thing (e.g. a brown triangle always represents a mountain peak). The labels and key for each map are then also added. Illustrations related to the maps – including diagrams, schematic maps, and infographics – complete the map image, which is then given a title and annotated with the relevant scale and map projection. The graphic combination of different subtopics therefore enables the editorial team to create a complex map, featuring water resources represented as coloured land masses, diagrams in the form of different coloured and sized drops of water to symbolise water consumption, and bar charts explaining access to the water supply. The topics of water footprints and virtual water are presented in separate infographics.
Each map editor condenses content and topics in a different way. Subjective perception of the selected topics and the geographical, social, and temporal context each play an important role in the reduction of content.
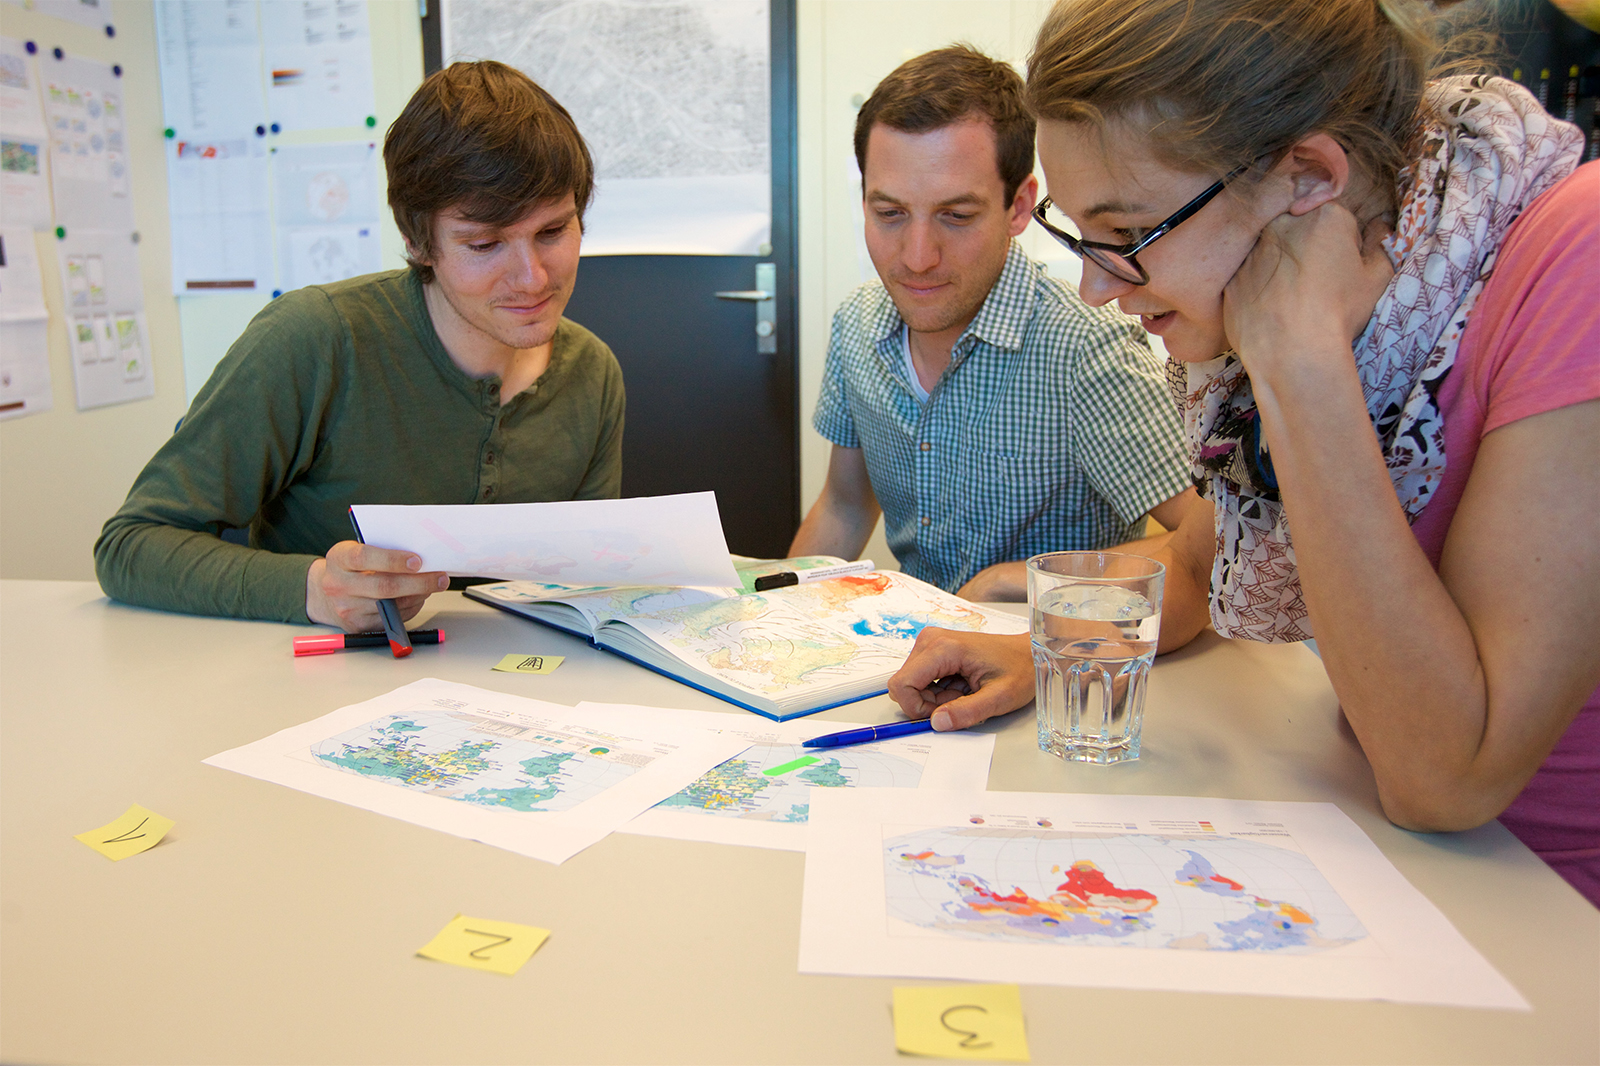
Likewise, data preparation and analysis can be carried out using different methods and even the technical, cartographic implementation of each map can be approached in different ways. As a result, the creation process results in a number of very different map drafts concerning a single topic. These drafts are discussed within the editorial team and with external experts and teaching professionals from different school levels and universities throughout Switzerland. The core target group is also not forgotten; school students are also occasionally given the opportunity to express their opinions on the different map drafts. The entire process can be repeated several times. Eventually, the most suitable version of the map is chosen and developed further, ensuring that the best possible illustrative maps make it into the atlas.
Three designs are discussed for the water map of Earth. The first draft depicts the qualitative availability of water. The second version features an illustration of regional water consumption. The third and final draft, which was later shortlisted for the atlas, includes both of the aforementioned subtopics presented in a slightly different cartographic form. Additional infrastructural details and the hydrological concept of the water footprint are also included.
The logical order, format, and position of the maps throughout the 256 pages of the atlas were already decided at the start of the project.
Using layout software, the finished maps are added to double-page spreads together with the page titles, numbers and side tabs. The water map is located at the back of the atlas after a large number of other world maps. It shares a page with the map of official languages.
Producing the atlas
The complete Swiss World Atlas is now available in digital form and can be viewed on the computer. The atlas files then enter the prepress stage. There, they are processed so that the printer can manufacture the printing plates needed for each printer’s sheet (one per colour). The atlas is printed in six colours and is then compiled into the finished book by our bookbinder.
The atlas is now finished and the digital version can already be explored on the computer. The digital atlas data is then forwarded to a prepress partner company.
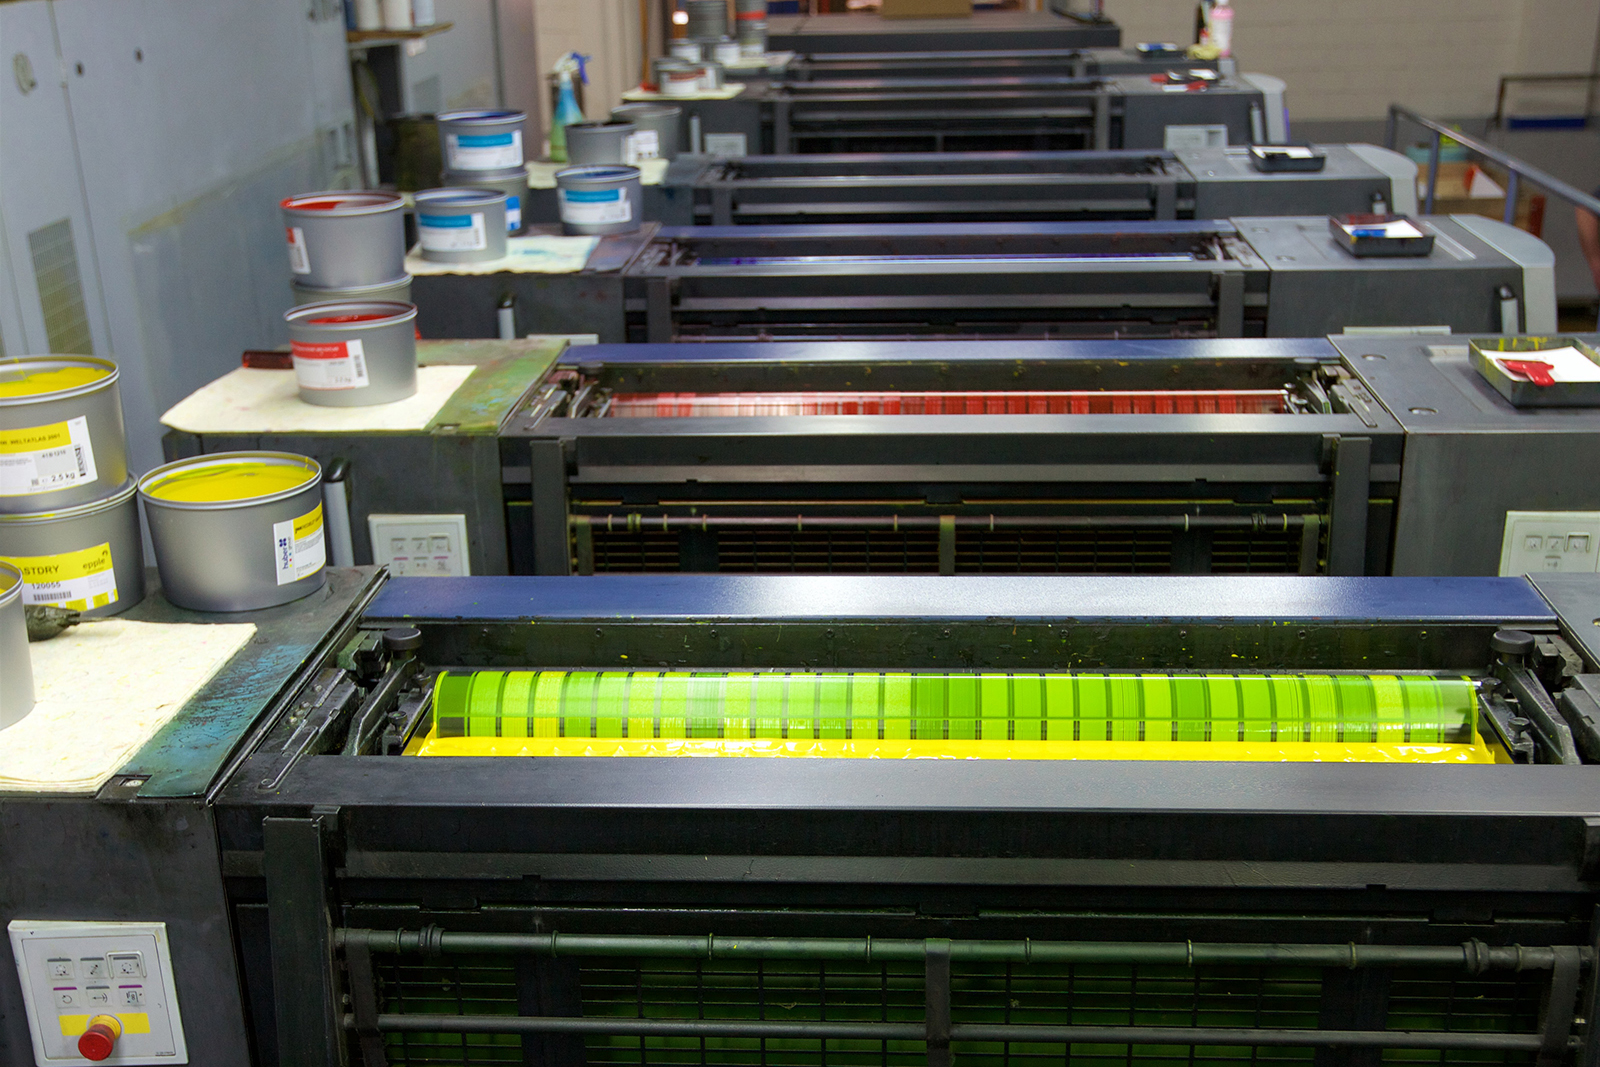
Using special software, 16 atlas pages are transferred onto one of 16 printer’s sheets in a process called ‘imposition’. A printer’s sheet comprises a front and reverse side, each featuring eight atlas pages. Each print template is created in the six printing inks and sent to the printer in digital form. The printer creates a printing plate for each template in each of the colours cyan (blue), red, yellow, grey and brown. In addition, three printing plates are created for the colour black: one for the German, one for the French, and one for the Italian edition. The three language editions therefore only really differ in terms of the text, printed in black. The finished printing plates are attached to the printing cylinders of a large offset printing machine. The areas of the plates where images will be printed are coloured using an inking unit. The white space on each aluminium plate is covered with a thin film of water. The colour is then transferred to a second cylinder covered in a rubber blanket before being offset to the paper. The printing machine is over 10 m long and can print several thousand printer’s sheets per hour. All 16 printer’s sheets are first printed on the front side (face printing), before being printed on the reverse side (reverse printing) during a second print run. The printer’s pages are then sorted by page number and language version, before being stapled in preparation for transport to the bookbinder.
The water map is printed during the second print run for printer’s sheet 13 as a reverse print on the reverse side of the paper.
10
Binding
Once the Swiss World Atlas’ 16 printer’s sheets have been printed, they can be bound into a book. The following video demonstrates the different steps in the bookbinding process.
The finished atlases are loaded onto pallets in lots of 500 and transported from the bookbinder to the warehouses of the publishers Lehrmittelverlag Zürich (German and Italian editions) and Schulverlag Plus in Bern (French edition).
The publishers then take orders from schools, book stores and private individuals, arrange deliveries, and send the atlases to their customers.
And so the water map finds its way into classrooms, staff rooms and living rooms throughout the country.
Using the atlas
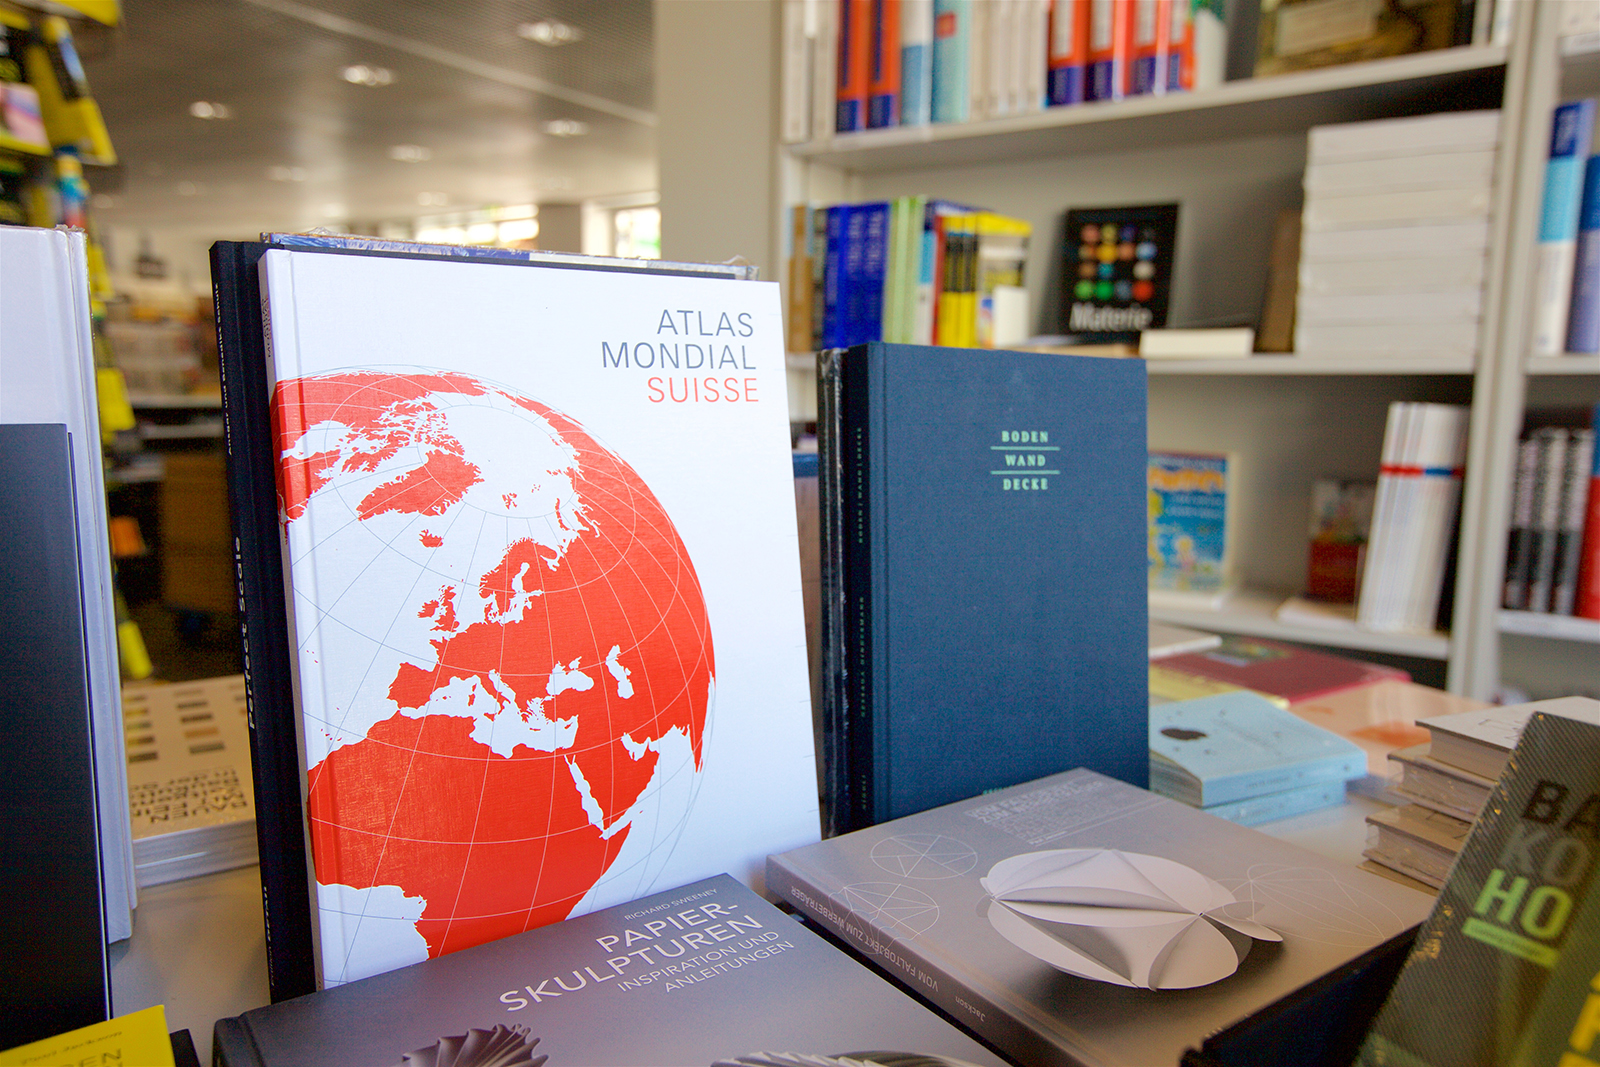
The Swiss World Atlas is now in the hands of its new owner. The atlas can be used to teach targeted and efficient map skills to school students, but the extensive maps in the Swiss World Atlas are also sure to entice readers at home.
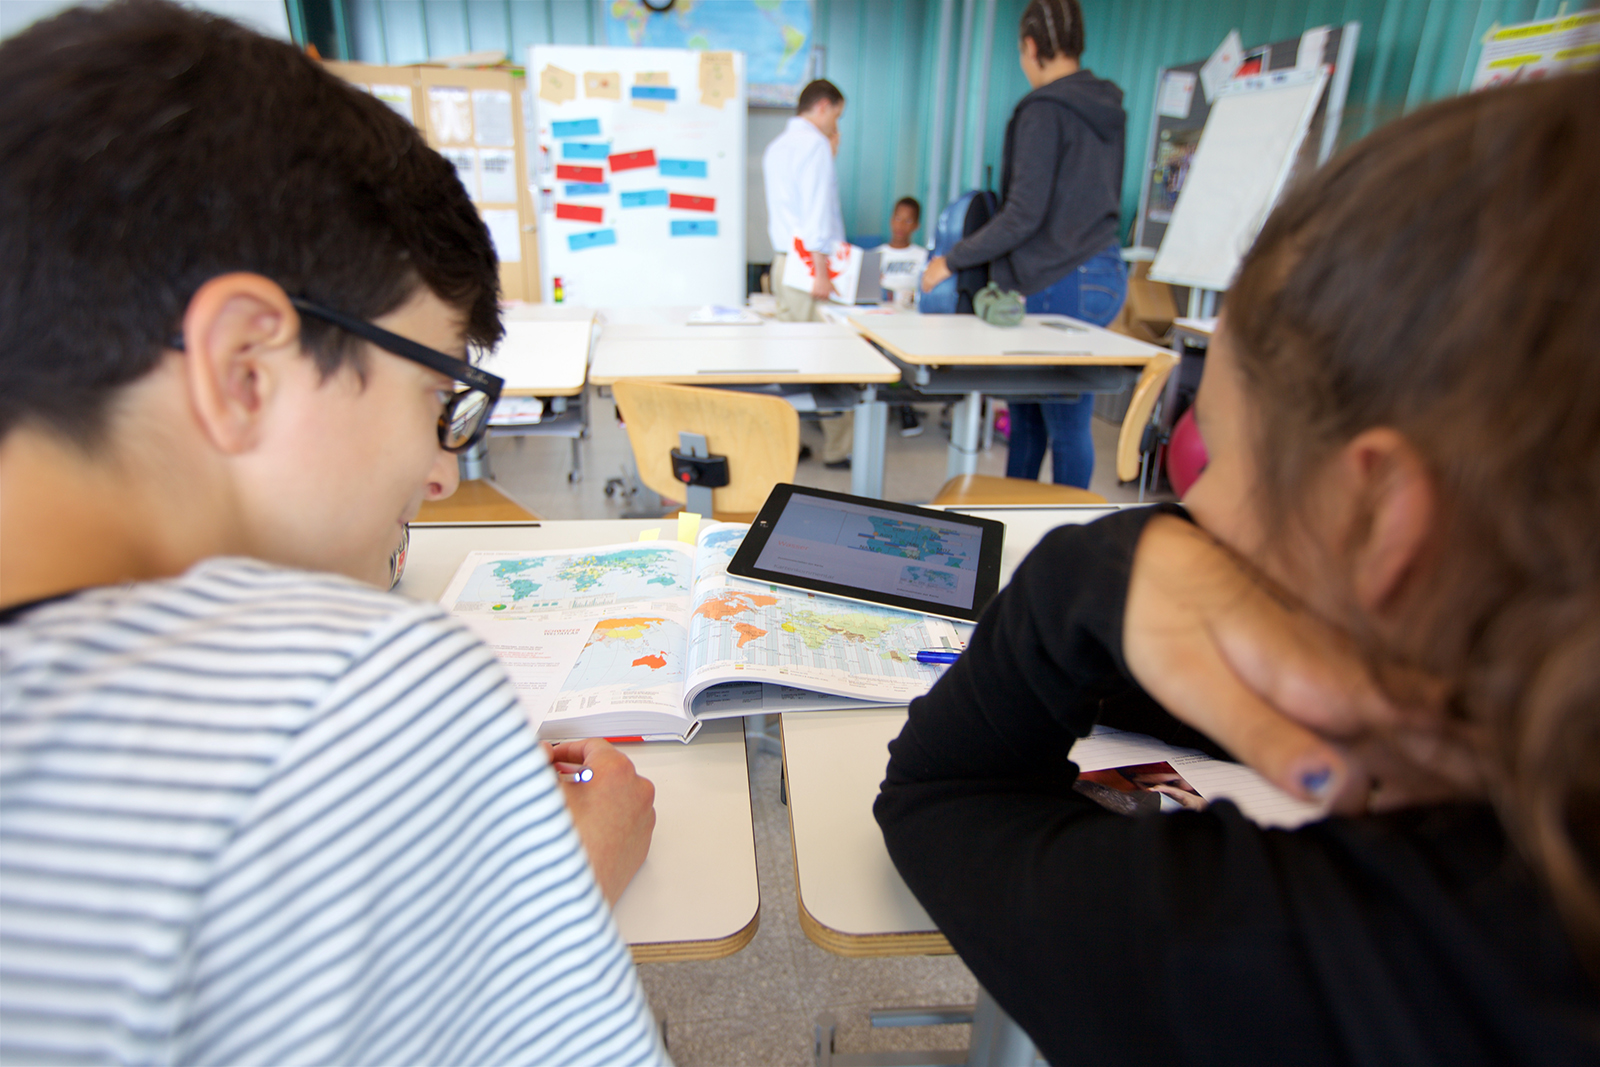
Finally, the new Swiss World Atlas makes its way to a student’s desk and is opened on page 206, where they will see the water map. With help from a worksheet provided by their teacher, the student can now evaluate the map and use it to answer geographical questions.
This could involve identifying and classifying different objects on the map using the key; they can be counted and compared with one another, for instance. Spatial patterns can be interpreted, relationships and interdependencies can be identified, and potential solutions to specific problems can be developed. The results can then be recorded on a blank map. Finally, the student can access the Swiss World Atlas website and search for the term ‘water’ from the homepage. They can then navigate to the relevant water map on the website, where they will find additional materials such as the ‘map commentary’, which contains additional information for download. By comparing their own findings and conclusions to the commentary, the student will be able to form a comprehensive understanding of the topic ‘Water’.
Through ongoing work with the Swiss World Atlas, students will become increasingly competent and goal-oriented when dealing with a wide range of maps and topics.

